An Answer For Everything: Rob Orchard’s favourite infographic
Rob Orchard chooses an infographic from our new book, An Answer For Everything, which visualises the data on everything from the best sportsperson of all time to how to become prime minister, how to save the planet and the best thing since sliced bread
We asked Delayed Gratification’s co-editor, Rob Orchard to choose his favourite infographic from An Answer For Everything, which is published on 28th October. He’s selected a particularly evocative infographic about the Covid-19 pandemic, ‘What was life like in lockdown?’

We’re giving away a special print of this infographic. Head here for information on how to enter – and make sure you get your entries in before 28th October 2021.
Where did the inspiration for ‘What was life like in lockdown?’ come from?
Rob Orchard: It was originally part of a package on Covid-19 infographics we created for Delayed Gratification. We’ve made lots of infographics on the pandemic but this is my favourite because it pulls off a really difficult trick – it quantifies human experience and captures a moment in time.
Where is the data from?
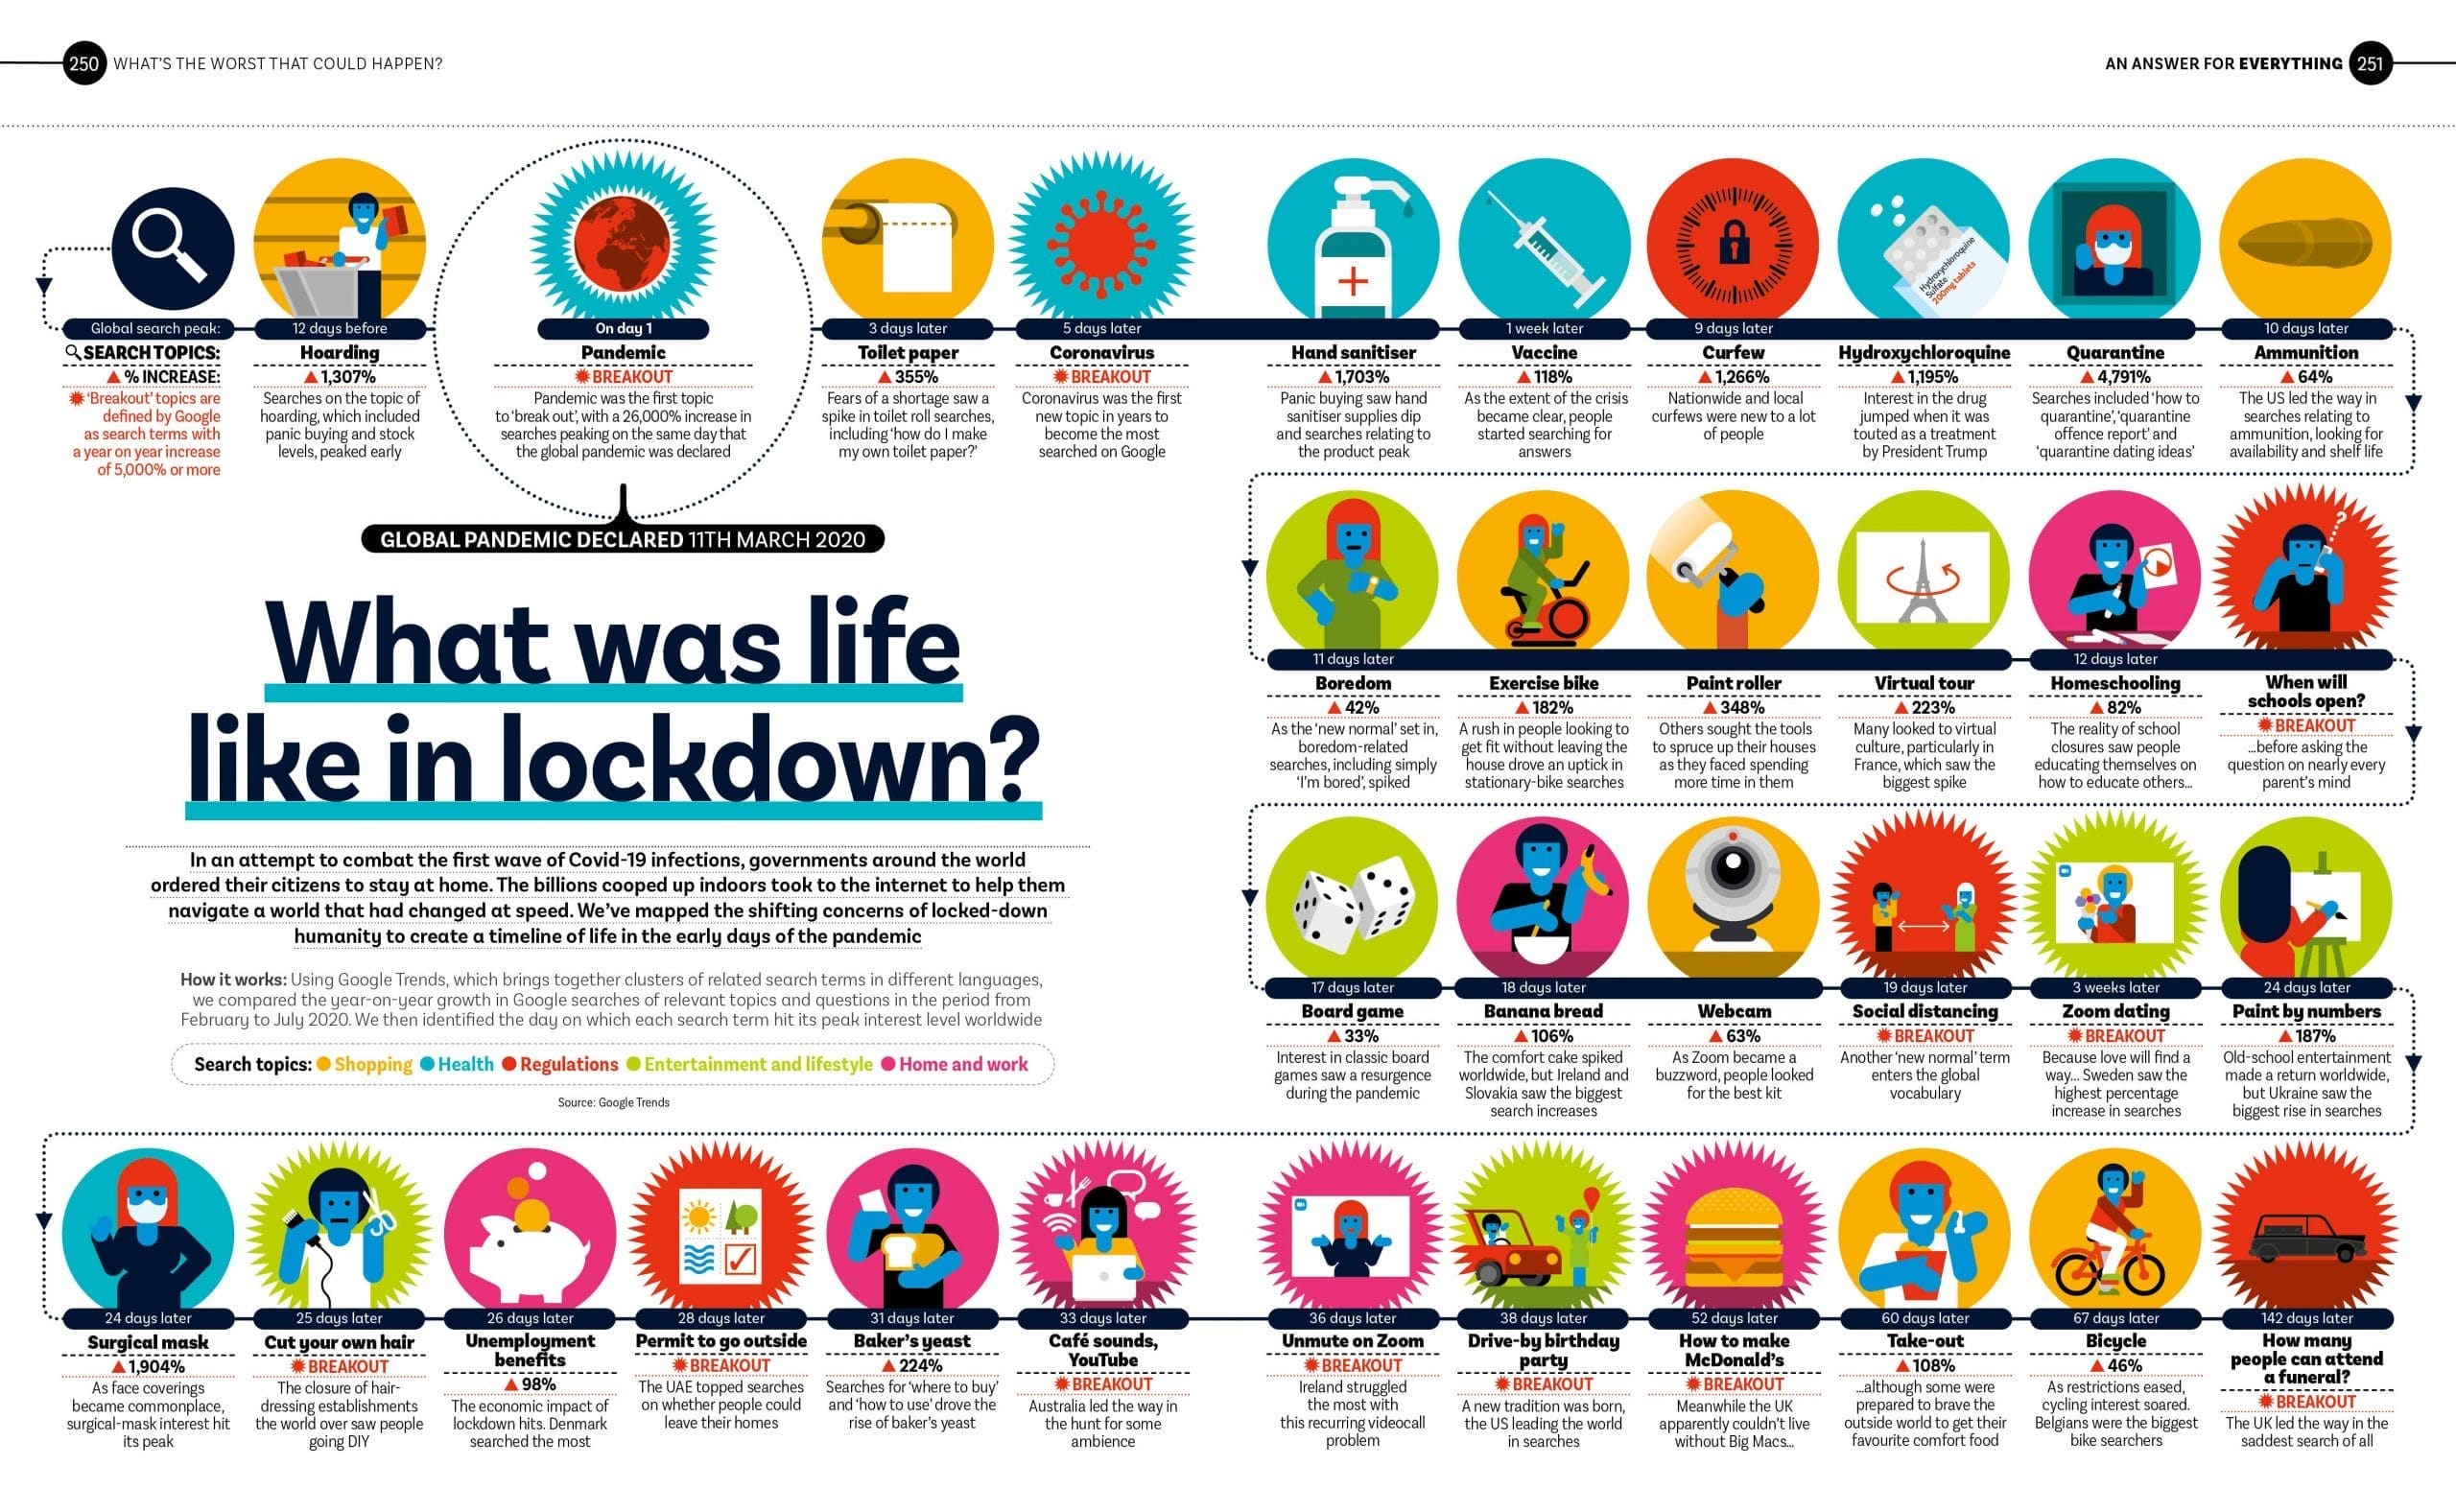
RO: It’s from Google. We had lots of discussions with them about how we could get insights into this unprecedented period, when a third of the global population was in lockdown, and we ended up with lots of different data sets, many of which we ended up not using. For this infographic we ended used Google Trends to compare year-on-year growth in searches of relevant topics and questions from February to July 2020. Crucially we looked for terms that spiked, so we saw many terms that had never or barely ever been searched for before. In these two pages we’ve captured an extraordinary moment in time that everybody was affected by. I think people will look at this infographic ten years from now and think “God, that was an odd thing we all lived through”.
How did you come up with the visual approach for this infographic?
RO: It’s very simple, we didn’t want to overwork it. The spine was always going to be a timeline because you needed to be rooted in this lockdown period, and the fascinating thing is how the search terms change as people become more accustomed to the new way of doing things. The illustrations in the book are all by our art director, Christian Tate, and he’s the absolute master of evoking emotion through simple illustrations – I particularly love the woman representing ‘Boredom’ and the grinning man making banana bread.
Are there any sections of the timeline that particularly stand out to you?
RO: There’s a particularly evocative sequence right at the start. Twelve days before the WHO declared a pandemic there was a huge spike in searches for ‘Hoarding’. And after the pandemic is declared there’s searches for ‘Toilet paper’, ‘Coronavirus’ – because people are still trying to work out what it is – then ‘Hand sanitiser’, ‘Vaccine’, ‘Curfew’… and a day after ‘Ammunition’ spikes, driven largely by American users. Then we get boredom-related searches, including the simple phrase, “I’m bored”. How human is that?
Is it hard to capture human experience through infographics?
RO: It usually is, because it’s numbers we’re working with, it’s data. But for this we removed most of the numbers so we could focus on the human aspect – it’s very funny in places, like when ‘Unmute on Zoom’ spikes, but it’s also very sad. It’s poignant to see how people searched for cafe sounds on YouTube because people were so bored and lonely at home, and it ends with ‘How many people can attend a funeral?’ a question that nobody would ever have asked a year earlier. In the book it comes straight after an infographic about how Covid-19 spread around the world, which is very clinical and chilling, and hauntingly beautiful – a timeline with proportionality representing Covid deaths per region. This one has a very different feel.
Why is this your favourite infographic in the book?
RO: A load of my favourites are in this chapter, which we’ve called ‘What’s the worst that can happen?’ I think it’s because I do spend a lot of my time thinking about the worst things that could happen, and then trying to mitigate them and put them in context. This infographic took up a large amount of time; there’s probably three or four weeks of solid work just on these two pages. But I do love the fact that the pandemic is probably the most data-mined event in the history of humanity and nobody else has taken this data and made this infographic. I’m really proud of it. 
This infographic is taken from An Answer For Everything, to be published by Bloomsbury on 28th October. Head here to pre-order the book and here to find out more about Delayed Gratification.