
Inside DG #59: Nuclear weapons in infographics
A Q&A with the writer of our infographics explainer on nuclear weapons from issue 59 of Delayed Gratification
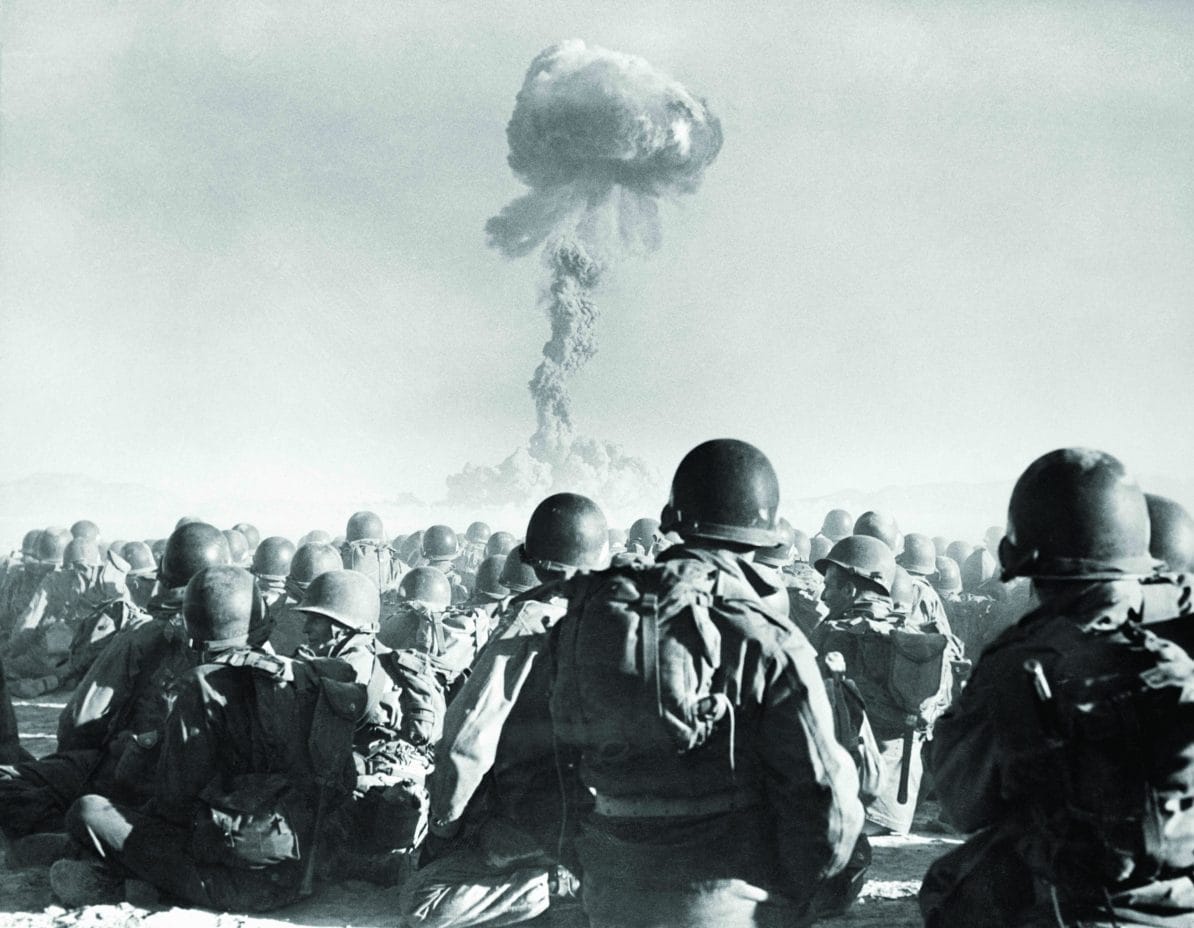
The 59th issue of Delayed Gratification features a series of infographics by Marcus Webb and Christian Tate about nuclear weapons. Rob Orchard spoke to Marcus about what readers can expect…
Rob Orchard: Why did you dedicate ten pages of the new issue to an infographic explainer on nuclear weapons?
Marcus Webb: There were a number of big stories involving nuclear weapons between April and June, the period this issue of the magazine covers. We had a brief conflict between India and Pakistan, two countries with nuclear arms; Russia stated that it reserves the right to use nuclear weapons against western countries, and of course there were the operations by Israel and the US against Iran’s nuclear facilities. We talked about the best way of covering these – it could be an interview with an expert, or an on-the-ground report from any one of them, but in the end we realised that as a team we didn’t fully understand the current state of nuclear weapons and thought something that explained it clearly and logically would be really helpful. We figured if we felt like that, there’s a good chance a lot of our readers would too.
RO: What’s in the package of infographics?
MW: We look at the Doomsday Clock, which has been assessing how close humanity is “to destroying our world with dangerous technologies of our own making” since 1947. Then we look at what it takes to build a nuclear bomb, which I found fascinating – particularly how and why uranium is enriched, and the different levels required for nuclear power compared to a weapon. Next, we have a timeline infographic showing how the number of active warheads has ebbed and flowed over the last 80 years, peaking in 1986. Finally, we look at the potential impact of a nuclear bomb hitting London and ask which nations might go nuclear next.
RO: What did you learn during the research that has stayed with you?
MW: The data on what would happen if a nuclear bomb hit London is hard to forget. We modelled what would happen if the largest nuclear device ever detonated – the Soviet Union’s Tsar Bomba – exploded above the Houses of Parliament. There would be over 5.7 million casualties and you’d feel the effects as far east as Southend-on-Sea and as far west as Reading. What was even more sobering is that the original design for the Tsar Bomba was twice as powerful as the one they tested.
RO: Isn’t this all in the past?
MW: Sadly not. At the start of 2025, the Doomsday Clock was set the closest it has ever been to midnight – representing the end of the world – and that was before Russia’s sabre-rattling and the events in Iran and Kashmir. As they put it, in the last year “humanity edged ever closer to catastrophe… Countries that possess nuclear weapons are increasing the size and role of their arsenals”. So it seems as important as ever to really get to grips with the state of nuclear arms.
You can read the full infographics explainer about nuclear weapons in issue 59 of Delayed Gratification, available from our online shop here.
Slow Journalism in your inbox, plus infographics, offers and more: sign up for the free DG newsletter. Sign me up
Thanks for signing up.