An Answer For Everything: Christian Tate’s favourite infographic
An infographic taken from our new book, An Answer For Everything, which visualises the data on everything from the best sportsperson of all time to how to become prime minister, how to save the planet and the best thing since sliced bread
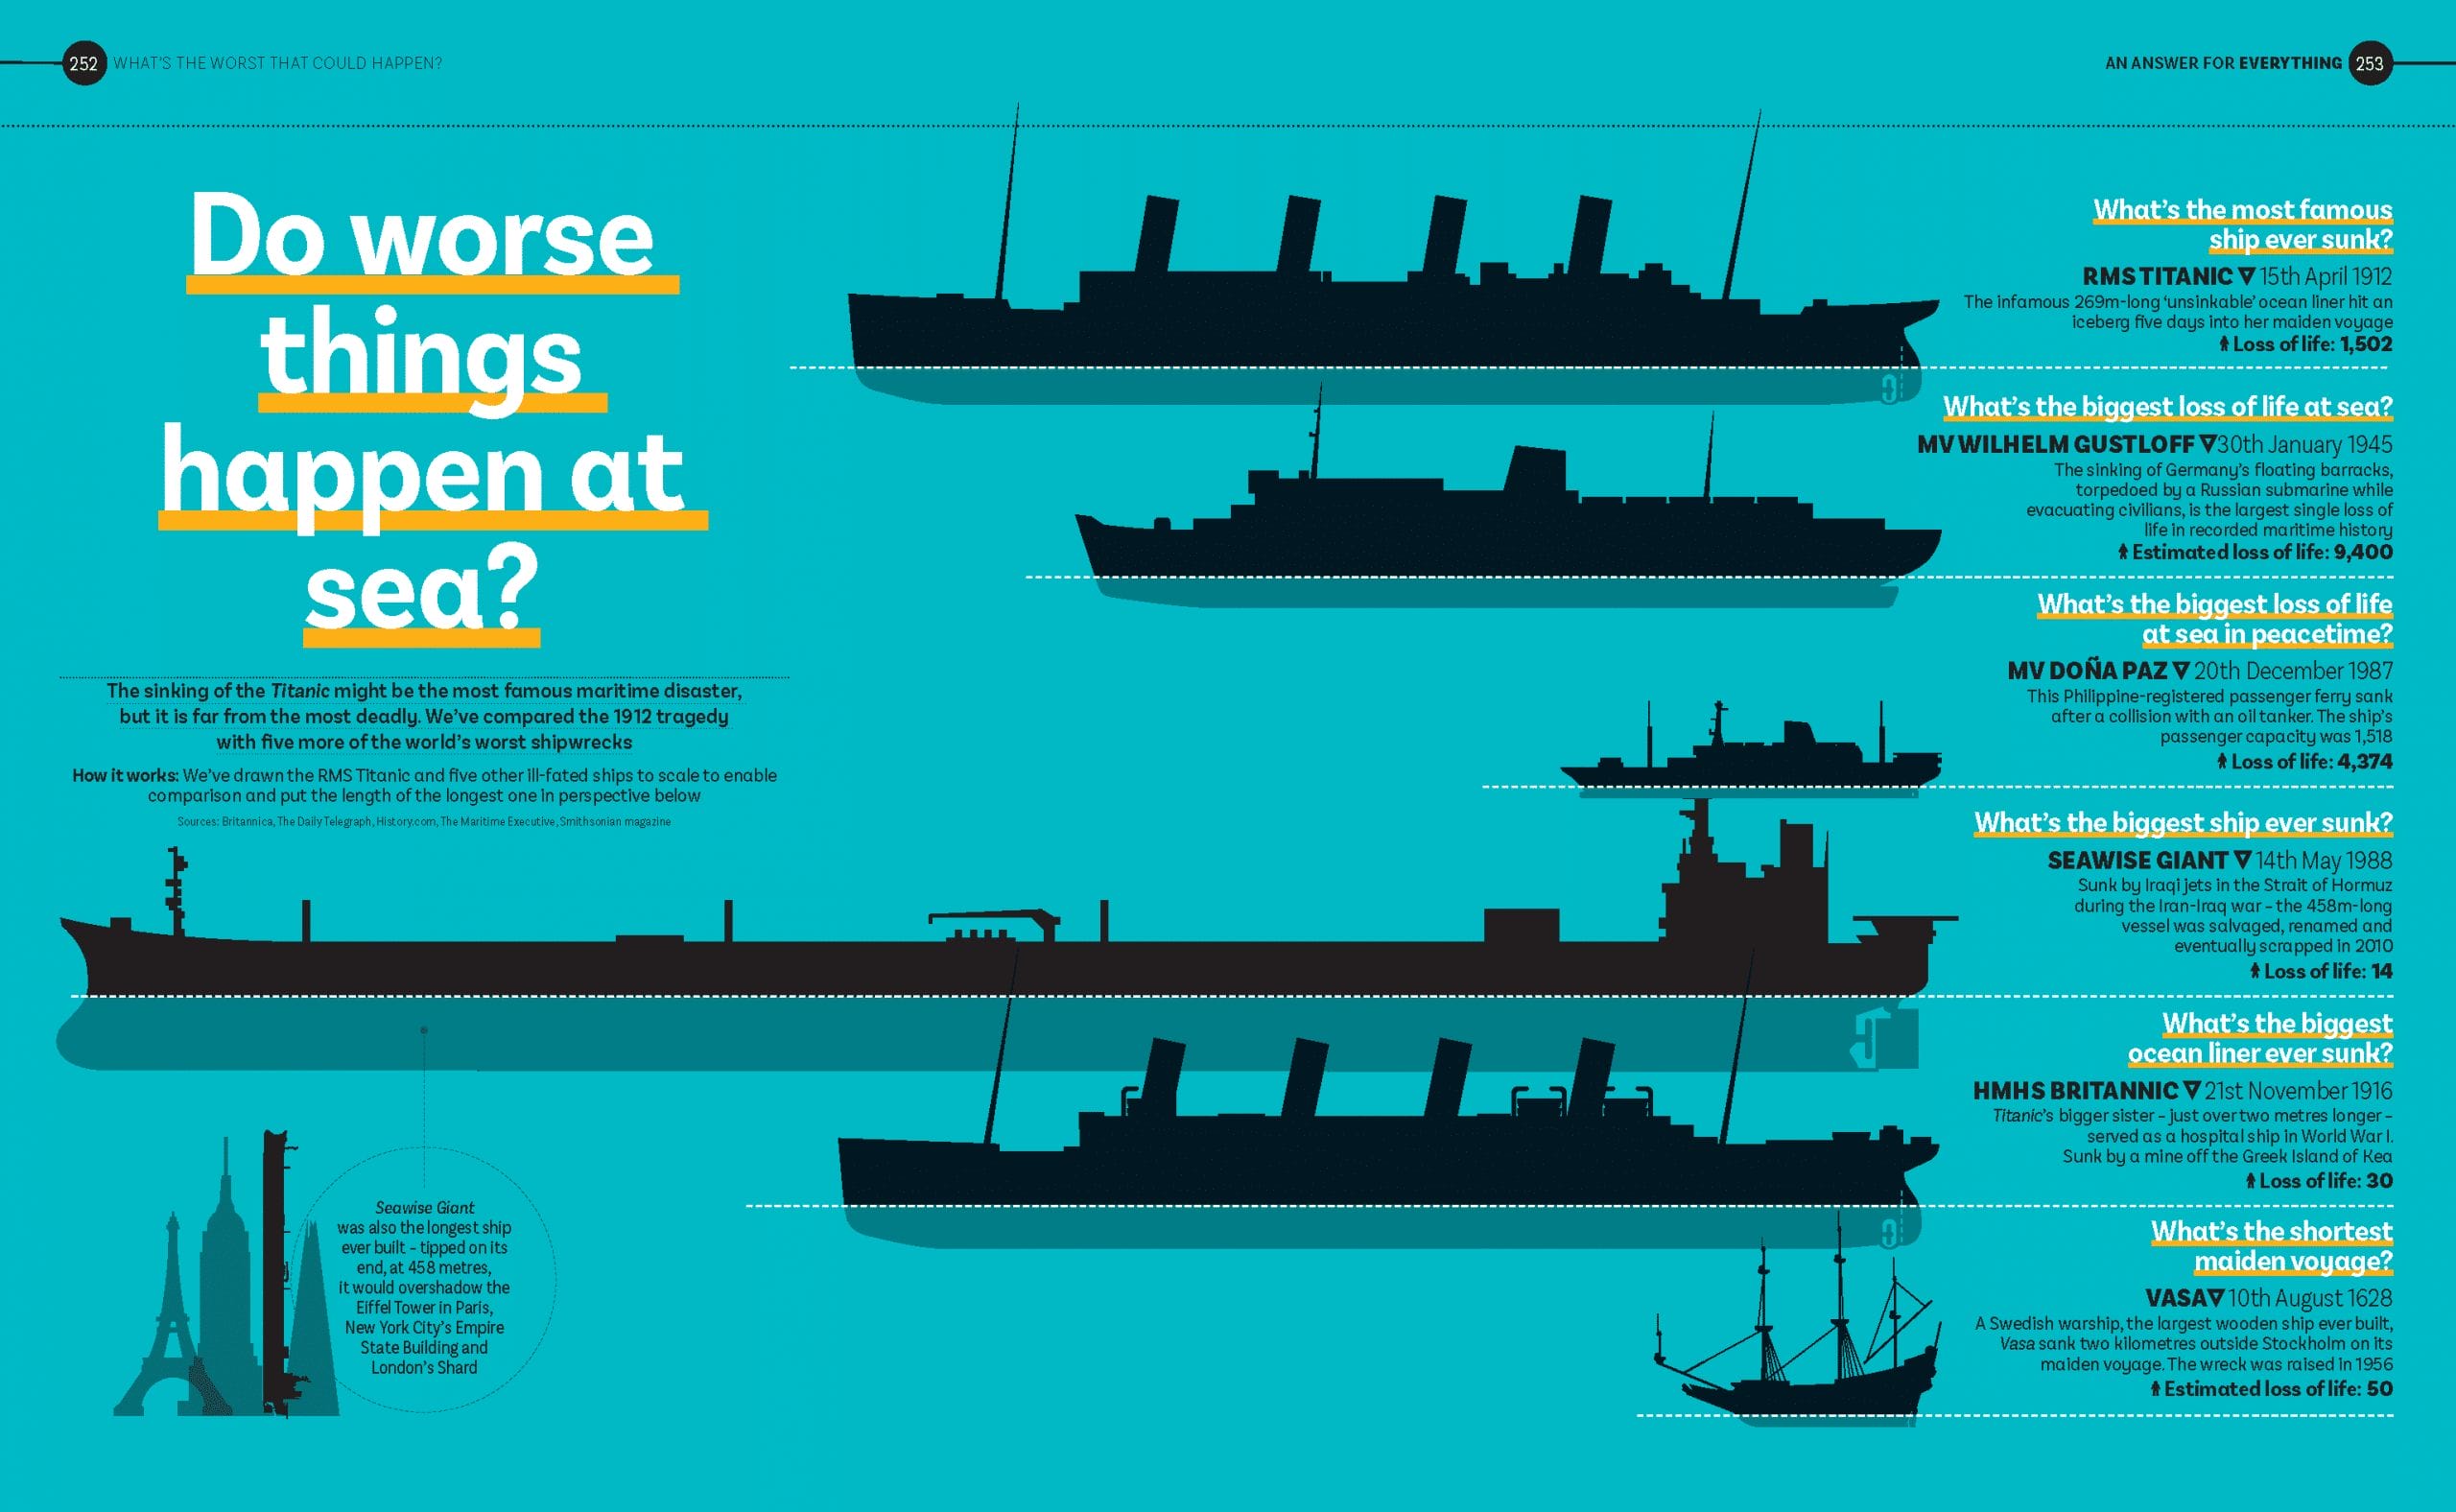
Delayed Gratification‘s art director, Christian Tate, designed and illustrated our new book of infographics, An Answer For Everything, in its entirety. We asked him to select his favourite infographic from the book and he chose ‘Do worse things happen at sea?’ (above) which compares history’s worst maritime disasters.

We’re giving away a limited-edition framed print of this infographic. Head here for information on how to enter – and make sure you get your entries in before 28th October 2021.
Where did the inspiration for ‘Do worse things happen at sea?’ come from?
Christian Tate: The original version of this infographic was published in issue #6 of Delayed Gratification back in 2012, at the time of the centenary of the sinking of the Titanic. It was really hard to find a fresh approach for a data visualisation on a topic so widely covered, but when we looked at some of the widely-held assumptions about the Titanic – it was the worst ever maritime disaster, it was the shortest ever maiden voyage etc – we discovered that several of them weren’t actually true. Then we found all these fascinating stories about maritime disasters that few people know about.
How did you decide on the visual approach?
CT: I wanted to make it as simple as possible. I used silhouettes because the Titanic silhouette is very recognisable, and also because there’s an established visual language of using silhouettes for ships; for instance, Jane’s Fighting Ships, an annual reference book of all the world’s warships, uses silhouettes.
How accurate are your illustrations?
CT: As accurate as possible! Wherever I can I use proper scale drawings obtained from reliable sources online. In the case of the Philippine passenger ferry, the MV Doña Paz, I couldn’t find reliable drawings anywhere so I had to use photographs. I found a reliable source for the length of the ship and then I had to carefully study a number of different photographs, looking out for objects dockside that offer a sense of scale such as cranes or lorries.
What surprised you while doing the research for this?
CT: I was surprised by how little known maritime disasters not involving the RMS Titanic are. The MV Doña Paz tragedy isn’t well known outside of Asia, but it had nearly three times more passenger deaths than the Titanic.
Why is this your favourite infographic in the book?
CT: I love that it’s so simple, and I like that it goes off on tangents and brings you stories you didn’t know. Also, it’s got the perfect headline, and there’s an Eiffel Tower in it. There are lots of Eiffel Towers in An Answer For Everything. It’s a great unit of measurement for comparison to big things because most people have an idea of how big the Eiffel Tower is.
This infographic is taken from An Answer For Everything, to be published by Bloomsbury on 28th October. Head here to pre-order the book and here to find out more about Delayed Gratification.