Your browser is out of date. Some of the content on this site will not work properly as a result.
Upgrade your browser for a faster, better, and safer web experience.

Infographic: How Donald Trump won the White House

Click below to get the code. Please include an attribution to Delayed Gratification and a link with this graphic.

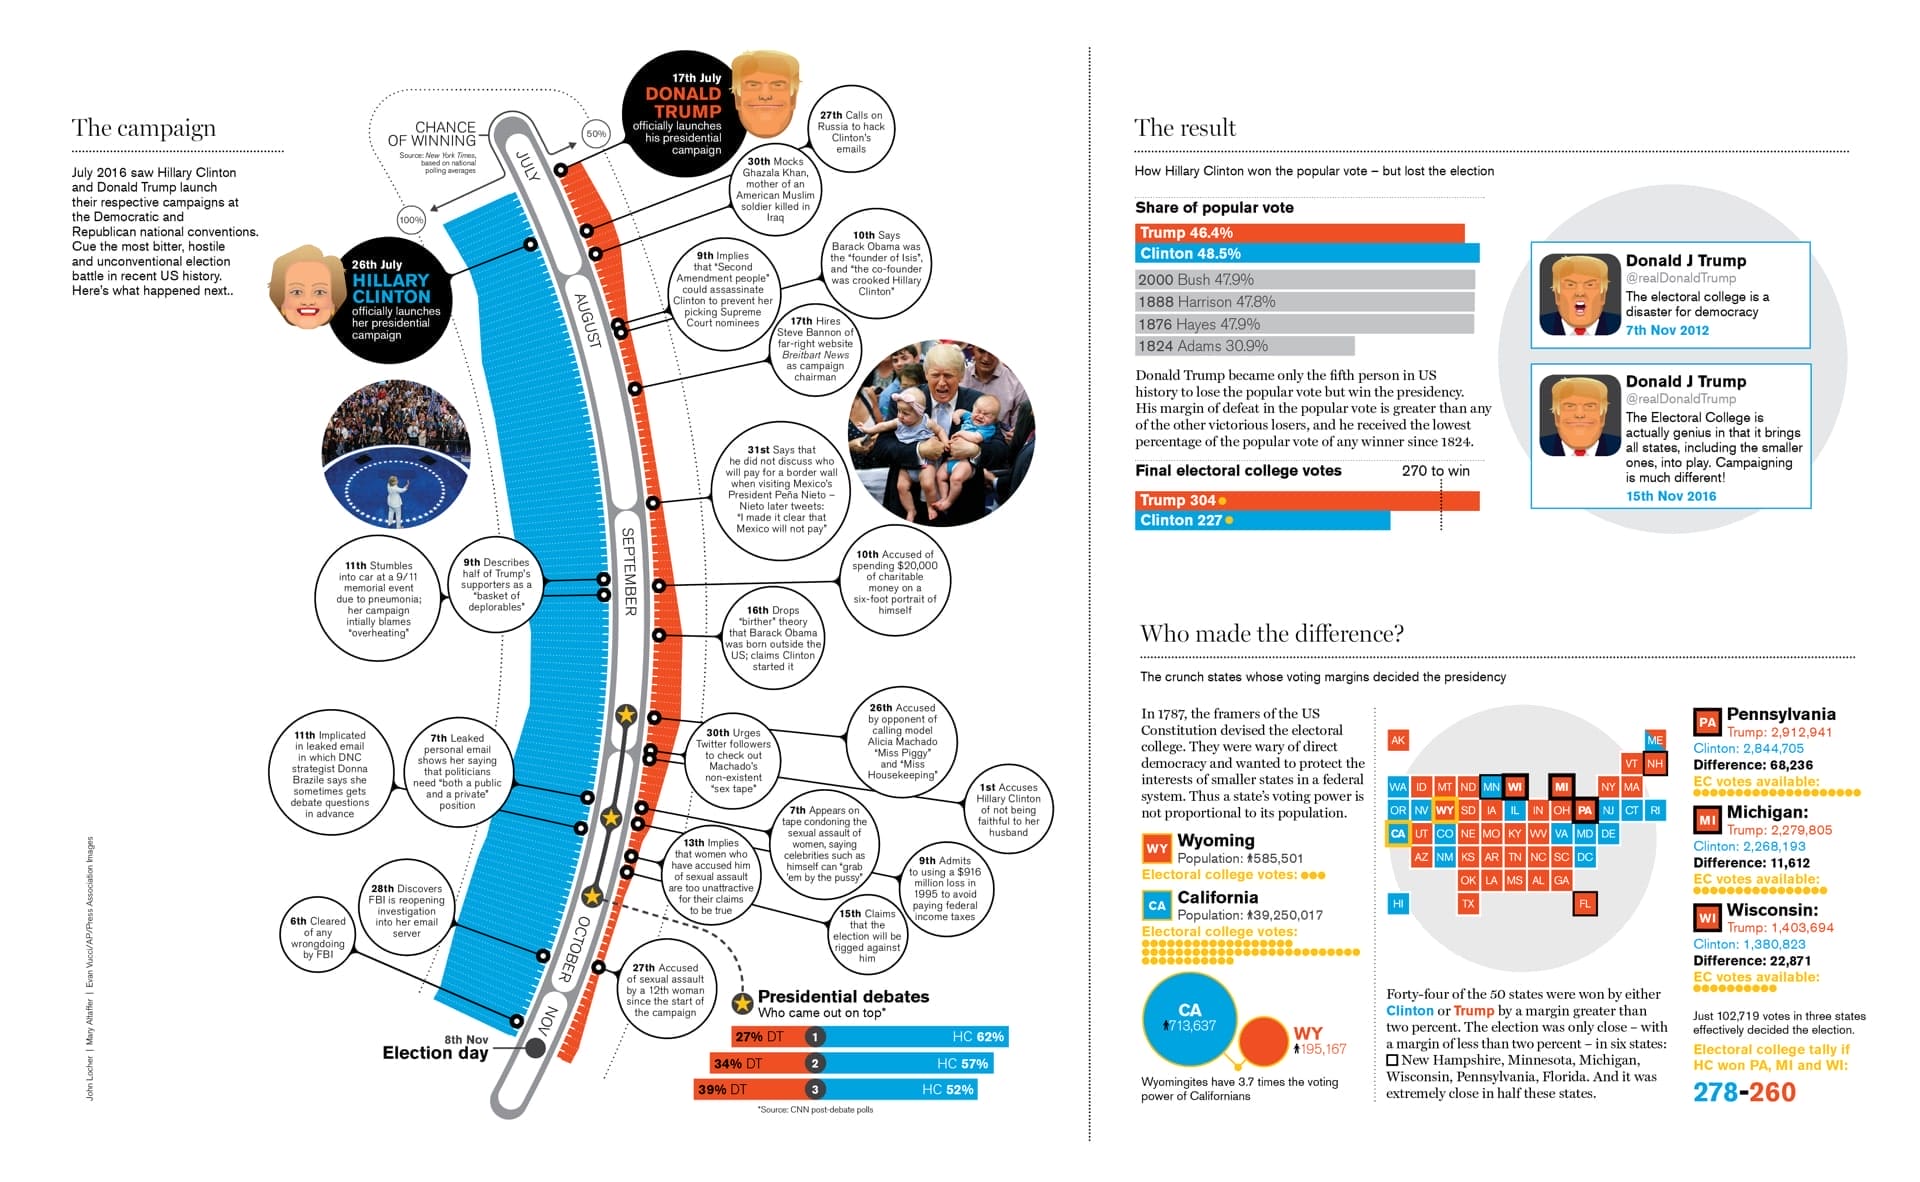
In DG #25 we looked back on the events that led to one of the biggest political upsets of recent decades: the election, against the predictions of pollsters and media the world over, of Donald Trump as US president on 8th November 2016.

Scroll over our infographics below, which chart a presidential campaign in which he was given poor odds of succeeding throughout and an election in which he received fewer votes than his opponent, but still, thanks to the US electoral college system, clinched victory in the end.

This infographic was published in DG#25. Pick up a copy in our online shop or take out an annual subscription using the promotion code ‘SLOWPOST’ and you’ll get our current issue for free.

A slower, more reflective type of journalism”
Creative Review

Jam-packed with information... a counterpoint to the speedy news feeds we've grown accustomed to”
Creative Review

A leisurely (and contrary) look backwards over the previous three months”
The Telegraph

Quality, intelligence and inspiration: the trilogy that drives the makers of Delayed Gratification”
El Mundo

Refreshing... parries the rush of 24-hour news with 'slow journalism'”
The Telegraph

A very cool magazine... It's like if Greenland Sharks made a newspaper”
Qi podcast

The UK's second-best magazine” Ian Hislop
Editor, Private Eye
Private Eye Magazine

Perhaps we could all get used to this Delayed idea...”
BBC Radio 4 - Today Programme